STEM vs. Non-STEM approval rates in EB2 NIW
Approval rates for EB2 NIW petitions have always been a topic of interest among those navigating the complex landscape of U.S. immigration. While quarterly reports from USCIS provide valuable insights, a recent report delves deeper into the nuances of approval rates, particularly in the context of STEM (Science, Technology, Engineering, and Mathematics) versus non-STEM fields. You can access the original report HERE.
In this article, we’ll dissect the key findings of recent report and explore what they mean for prospective petitioners.
STEM vs. Non-STEM: a closer look
The USCIS report sheds light on the approval rates within EB2 NIW, categorized by STEM and non-STEM fields. Stemming from the acronym for Science, Technology, Engineering, and Mathematics, STEM fields have traditionally enjoyed higher approval rates compared to non-STEM fields. The report confirms this trend, revealing a consistent gap in approval rates between the two categories.
In 2023, for instance, STEM-related endeavors boasted a significantly higher approval rate compared to their non-STEM counterparts, with a notable 20-point difference on average. This trend underscores the importance of understanding the landscape within one’s field of expertise when considering an EB2 NIW petition.
Key findings when looking at All jobs:
- Total receipts of Form I-140, with and without NIW (combined), increased by 20% from 70,600 to 84,470 from FY 2021 to FY 2022. They then rose by a further 10% from FY 2022 to FY 2023.
- Approvals with and without NIW (combined) experienced a significant increase of 60% from 57,810 in FY 2021 to 92,280 in FY 2022 but declined by approximately 12% to 81,380 in FY 2023.
- The approval rate with and without NIW (combined) remained consistently high, at 90% or above, from FY 2018 to FY 2023.
- Despite non-NIW petitions (i.e., with labor certification sponsored by employers) remaining the majority of I-140 receipts from FY 2021 to FY 2022, the percentage of receipts with NIWs compared to those without continued to rise, from 21% to 26%. This trend further intensified from 26% in FY 2022 to 43% in FY 2023. That’s where the number of petitions with NIWs nearly doubled, increasing from 21,990 in FY 2022 to 39,810 in FY 2023, while the number of petitions without NIWs decreased from 62,490 to 53,200 over the same period.
EB-2 Category Form I-140 Total Receipts, Completions, and Approvals: All Job Types (Source: USCIS)

Key findings when looking at STEM jobs:
- Receipts in STEM job categories decreased by nearly 13%, from 61,790 in FY 2022 to 53,960 in FY 2023 (with and without NIW). This was a result of a harsh, 15k decrease of non-NIW petitions (i.e., labor certification sponsored by employers), which was only partially offset by 7.4k increase of NIW petitions.
- Approval rates of non-NIW petitions remain consistently strong, and above 98% across 2018-2023.
- Approval rates of NIW petitions have been within 91%-96% in years 2018-2023, however then number of STEM NIW petitions was relatively small, 6-8k. Then significantly increased to 14.6k in 2022 (with approval rate of 95%) and to 23.4k in 2023 (with approval rate of 91%).
EB-2 Category Form I-140 Total Receipts, Approvals, and Denials: STEM Job Types (Source: USCIS)

Key findings when looking at non-STEM jobs:
- Receipts in non-STEM job categories increased by 28% from FY 2022 to FY 2023 (with and without NIW).This was a result of a significant, 5.8k increase of NIW petitions, while non-NIW petitions (i.e., labor certification sponsored by employers) decreased only slightly by 0.8k.
- Approval rates of non-NIW petitions remain consistently strong, and above 98% across 2018-2023.
- Approval rates of NIW petitions have been in 66-71% range in the worse years (2020, 2021, 2023) and 77-81% range in the better years (2018, 2019, 2022). However, number of non-STEM NIW petitions was pretty small initially (only 1-2k), and only increased to 4.4k in 2022 and to 11.4k in 2023.
EB-2 Category Form I-140 Total Receipts, Approvals, and Denials: Non-STEM Job Types (Source: USCIS)

Navigating the complexities
While data insights provide valuable guidance, it’s crucial to remember that success in EB2 NIW petitions isn’t solely determined by whether one’s field falls under STEM or non-STEM. Individual factors such as the quality of the petition package, the petitioner’s profile, and the skillful presentation of the case play significant roles.
Moreover, the subjective nature of the evaluation process means that outcomes can vary based on the reviewing officer. As such, petitioners must focus on crafting compelling narratives and presenting evidence that effectively demonstrates the national interest served by their work.
Conclusion: beyond statistics
While statistics offer valuable insights into approval trends, they should be viewed as part of a broader context. Ultimately, the success of an EB2 NIW petition hinges on a combination of factors, including the petitioner’s profile, the strength of the proposal, and the clarity of presentation.
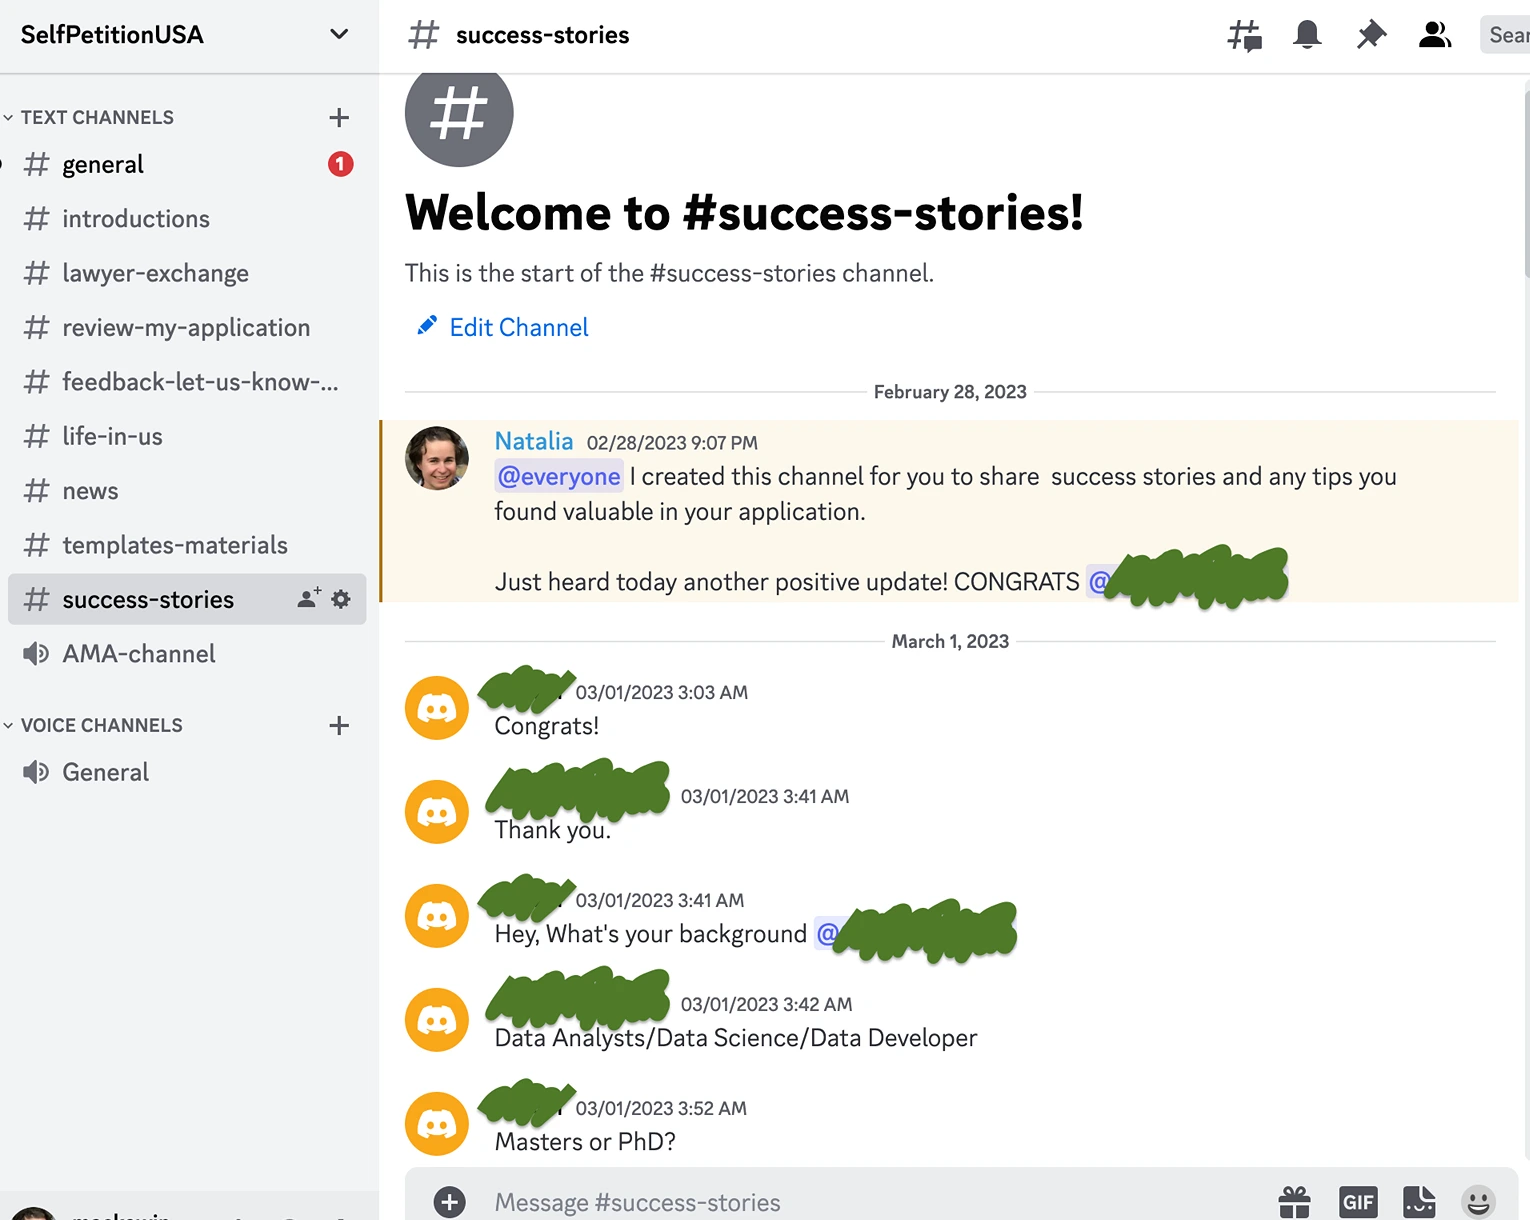
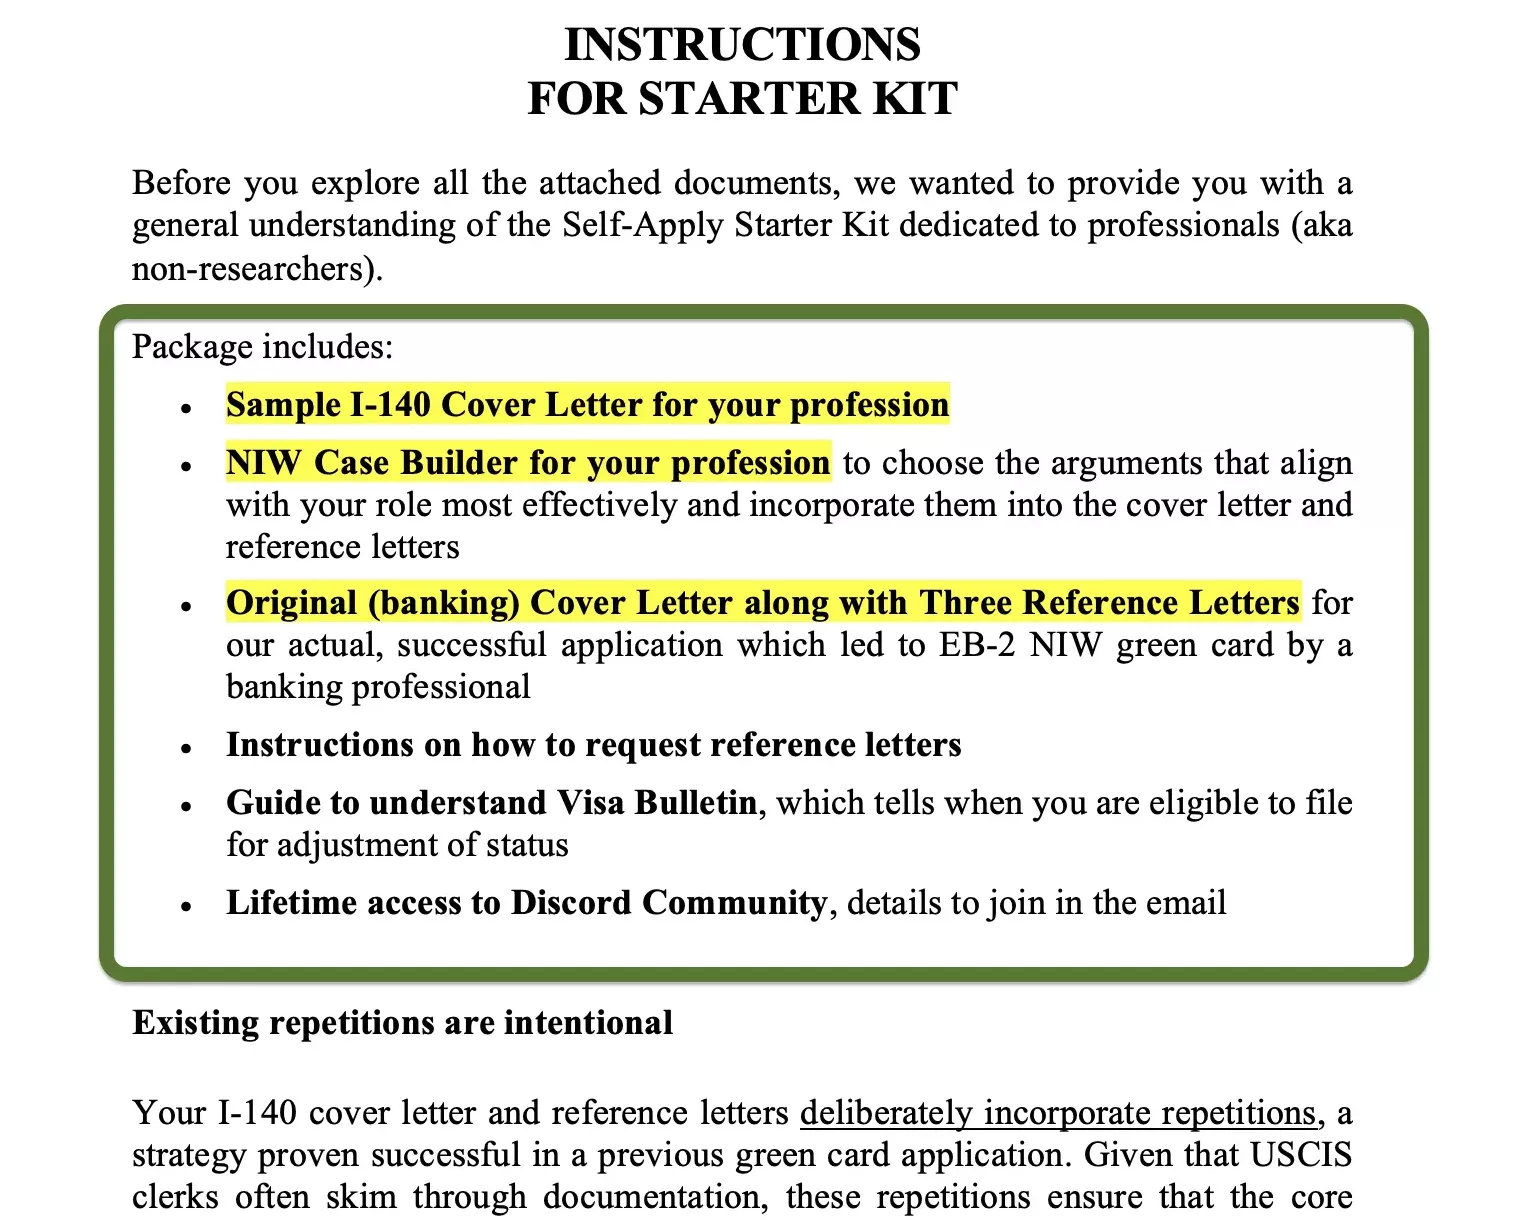
If you’re considering petitioning, take a look at our two options: the Starter Kit Templates and Selfpetition AI. The Starter Kit Templates provide standardized EB-2 NIW templates for various professions, but you’ll need to customize them to fit your background. Meanwhile, Selfpetition AI, our newest service, crafts personalized cover letters and reference letters tailored specifically to your background. Whether you’re a software engineer, project manager, entrepreneur, or in any other profession, you can find something that suits your needs.
